

Need help?
+91 98194 92971
Need help?
+91 98194 92971
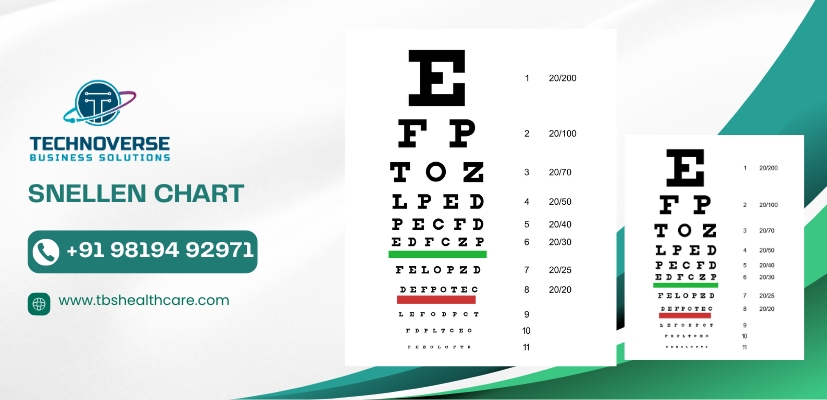
A Snellen chart is a tool commonly used by eye care professionals to measure visual acuity. It consists of a series of rows of letters or symbols that decrease in size from top to bottom. The person being tested reads the letters aloud, starting with the largest ones at the top. Each row corresponds to a specific level of vision sharpness, commonly marked by a fraction like "20/20. It's widely used in clinical settings to assess if someone has normal vision or requires glasses or other vision correction methods.
 India-Mumbai
Office Number 205, Unit No. 5 on Second Floor, GNP Arcadia, Plot No. RP-155, Sudarshan Nagar Cross Road Number 4, Near K V pendharkar College, MIDC Phase-1,
Dombivli East, kalyan ,Thane, Maharashtra, 421203
India-Delhi
Office number 818, 9th floor, Westend mall Janakpuri ,Opposite Janakpuri west metro station, Delhi- India 110058
 Kenya-Nairobi
Raira Centre, Raira Road Next To Junction Mall, Kilimani, Nairobi Kenya
 Dubai
Dubai
 Hongkong
 UK
UK
 Saudi Arabia
